The Power of Dashboards with Machine Learning for Pharma

by Harika Panuganty | Last Updated: July 28, 2020 | ![]() 1 min read
1 min read
Dashboards provide an organized solution to users who want an overall view of information that presents trends and growth. Loosely based on a car dashboard, business dashboards are tools for information management and business intelligence. They visually track, analyze, and display metrics as well as data points to monitor the health of a business unit or a specific process.
Users can collect and analyze information from dashboards, reports, and visualizations without the aid of data & IT specialists. Dashboards and business intelligence tools allow seamless communication and translation of insights among data scientists, analysts, developers, and statisticians.
Dashboard Development
The key to producing a functional dashboard is to understand the purpose as well as the target audience – the tool would be effective only when it connects with the userbase. A few questions to consider before developing a dashboard are:
- Who will this dashboard be geared towards?
- What goals is the user trying to accomplish?
- What key performance indicators or metrics need to be measured to reach that goal?

Defining the audience is certainly the most important task and it will set the stage for dashboard creation. Taking a large marketing firm as an example: manager goals could include generating more sales, increasing customer satisfaction, or improving reach across social media.
This dashboard would look very different than a dashboard for C-suite executives or shareholders at the same firm, whose interest is in understanding cash flow or comparing revenue numbers between quarters.
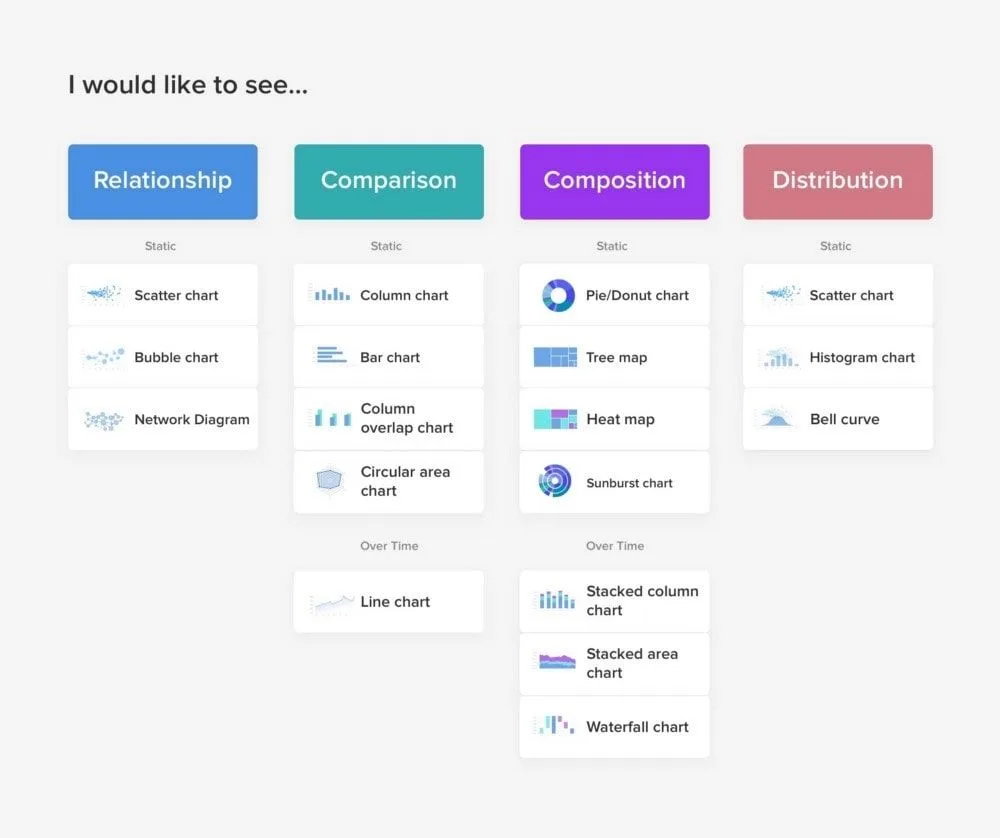
After gathering information on the audience, goals, and evaluation metrics, the next step in development is to design and configure the layout of the dashboard. Selecting the right chart types and visualizations is an important aspect of the process.
The image below, by Taras Bakusevych, displays the ideal chart type for different data relationships.
Additionally, filters and functions make it simple for users to analyze, arrange and view the data while maintaining the integrity of the dashboard design. Having an appropriate mix of past, predictive, and real-time data in the dashboard is essential, and this balance will significantly improve data-driven decision-making.
What are the different types of dashboards?
Analytical dashboards are most commonly used within business intelligence tools and identify trends that aid decision-making. They are based on predictive models providing insight into the data that aligns with a business goal. Along with tables, charts, and drill-downs, many of these dashboards have advanced business intelligence features such as predictive power and dynamic modeling.
Operational and strategic dashboards supply a cohesive picture of performance to users. Both types of dashboards are designed to track performance and progress. Operational dashboards are viewed more frequently as they follow more time-sensitive tasks. The main goals of these dashboards are to present data deviations, show current resources, and display present status.
Operational dashboards are used primarily by business managers and users, whereas strategic dashboards are tailored more towards executives.

Business Intelligence & Analytics – Advancements
The business intelligence and data visualization spaces show tremendous growth and capability in the future. Microsoft’s Power BI and Tableau recently introduced advanced analytics in the business intelligence fields to enhance dashboard functionality. Here are a few notable advances in the industry:
-
_Conversational Analytics
_Both companies have been leveraging artificial intelligence, natural language processing, and voice recognition for insight generation. Users can explore their datasets by asking questions to virtual assistants such as Siri or Cortana, which respond with the best answer and render visualizations accordingly. With no pre-defined dashboards, the visualization depends entirely on the retrieved data. The system works by parsing the input, interpreting the semantics, submitting the query, retrieving the output, and presenting the result.In the future, greater focus will be placed on improving the accuracy of the conversational analytics system. In addition to displaying query suggestions, the system would and begin to recommend and refine search queries to users based on historical queries and user profiles – allowing for deep data exploration like never before.
-
Multimedia Reports
The visualization experience can be in an interactive audiovisual setting for a stronger impact and a larger audience reach. Advanced analytic techniques could split a “traditional dashboard” into individual visualizations, with each visualization being a frame. An AI-generated voice could narrate the data story within each frame and by combining all the frames and respective voices, a video displaying up-to-date information could be created. -
Automated Notifications
With the advances in real-time data dashboards, notifications to users would be on the rise. It will be beneficial if the system notifies users with data it deems important based on the data, events, and user profiles. Notifications could permit for a quick turnaround for decision-makers, allowing for swift action based upon findings.
Business Intelligence & Analytics Leaders
The following companies are recognized by Gartner as leaders in Business Intelligence & Analytics1 for 2020.
The platforms from these companies are widely used and have become the leaders in the analytics category. This space – defined by Gartner as machine learning and artificial intelligence-assisted data preparation, insight generation, and insightful explanation that augment how business people and analysts explore data – is quickly becoming the key source of competitive differentiation among software development organizations.
-
Microsoft: The leader within the quadrant, the company’s product strategy is comprehensive and visionary. Power BI offers data preparation, data discovery, interactive dashboards, and augmented analytics. The Power BI cloud service overtook the majority of the competition, due to the introduction of augmented analytics, automated machine learning, and AI-powered services – text, image, and sentiment analytics.
-
Tableau: A user-favorite, the platform enables users to easily access, prepare, analyze, and present data findings. The introduction of “Ask Data2” and “Explain Data” in augmented analytics provided natural language query and automated insights. The visual-based exploratory experience coupled with the data manipulation capability is what makes Tableau shine in the data visualization and business intelligence space.
-
Qlik: The company’s associate data engine is the backbone behind their intelligent storytelling features and visualizations – it ingests data from multiple sources and understands relationships within the data. Qlik’s cognitive engine adds AI/ML functionality to the associate data engine to offer insight suggestions and analysis.
-
ThoughtSpot: The company differentiates itself with a search-based interface that supports complex questions. The interface includes AI-driven recommendations, autonomous monitoring of metrics, and database query options. ThoughtSpot’s SpotIQ utilizes AI to instantly uncover and deliver personalized insights – discover anomalies, identify causal relationships, analyze patterns, and look for similarities between groups of data.

Business intelligence tools permit the discovery of unseen data relationships and business opportunities. Modern analytics frameworks connect with dashboards to offer simpler interfaces and dynamic modeling. Intelligent dashboards coupled with state-of-the-art analytical frameworks and tools empower business users to make better business decisions.
Explore More Relevant Articles on P360
- P360/Swittons - Press Release - April 2020
- State Laws Seek to Regulate Sales Rep & Physician Interactions
- Power BI Insights for C-Suite from Microsoft MegaExpert Belinda Allen – Part 2
- 5 Ways To Maximize Pharma Sales Call Effectiveness
Our data management solution, called Data360, comes with built-in machine learning models that provide the insights, predictions, and next best actions at amazing accuracy to help you leverage the power of data science to make decisions as the industry changes.
If you’d like to learn more about Data360 and how our data management solution can transform your pharma company, click below to speak with one of our experts.
References
1: https://www.gartner.com/doc/reprints?id=1-1XYUYQ3I&ct=191219&st=sb
2: https://www.tableau.com/products/new-features/ask-data
Author Bio: Harika is an aspiring data scientist and holds a master’s degree in biomedical informatics with a focus in data science. She’s passionate about all things data but particularly, machine learning and artificial intelligence. Outside the data world, she’s a content writer in the areas of science, education and health.