











 CEO Corner
 HCP Corner







Home / Blogs / CEO Corner /
How do pharma brands measure whether HCPs actually respond?
CEO Corner is P360's leadership series, in which its CEO writes about how pharma commercial actually works and how the industry and HCPs communicate.
The only reliable way pharma brands can measure whether HCPs actually respond is the reply rate: the share of HCPs reached who answered back, counted on the record, with the method published. Sends, deliveries, opens and a vendor’s wall of pharma customer logos all count the brand’s side of the exchange; none of them shows that a single HCP wrote back. P360 reports a 60% average reply rate.
In July I wrote that pharma commercial still runs on lists, and that the operating assumption is that the number equals the relationship. In September I called it the whole problem.
Our industry carries a second version of that assumption. It belongs to the vendor side, which is the side my company sits on. It hangs on websites, fills a slide in the pitch deck and turns up again in the analyst slide: the wall of pharma customer logos. The assumption behind it is that a signed contract equals engagement.
Why customer logos don't measure HCP engagement
A wall of pharma customer logos proves that a contract was signed. A brand said yes to trying something, and that is real.
The wall persists because it answers a fair question: has anyone like us trusted this before? In an industry where a single oversight can travel a long way, that question deserves an answer. But it is a question about the vendor. It is also where the evidence ends.
A logo cannot tell anyone whether the program launched, whether it reached a single HCP, or whether one HCP ever wrote back. It records the day the pharma company agreed. It records nothing the HCP did.
Arranging the logos differently does not change that. A longer wall proves more signatures.
How to measure HCP response with a reply rate
Pharma brands measure whether HCPs actually respond by counting replies, and very little in the standard outreach report does that job. In most outreach reports I see, the numbers count the brand’s own activity: messages sent, messages delivered, emails opened, HCPs reached. Every one of those numbers describes something the brand did.
Opened isn’t answered. An open says a message reached a screen. A reply says an HCP read it and chose to write back, with a question, a request or a time to talk. It is the only number in the report that describes something the HCP did.
Measuring the HCP reply rate is simple to state and hard to fake. An HCP reply rate has four parts:
- Replies: the HCPs who answered back.
- Reach: the HCPs the program reached.
- Period: the dates the count covers.
- Method: written down and published where anyone can check it.
A reply rate also shows a brand where to look next: which messages HCPs answer, which they leave alone, and which channel they choose when they do answer. A send count can’t show any of that, because it stops at the brand’s own edge.
In our industry, that reply also has to happen on the record. Approved content goes out, the HCP’s answer is captured, and every exchange is traceable. That discipline isn’t what makes reply rate hard to report. It’s what makes the number worth believing.
Why HCP reply rates rarely appear next to customer logos
In the vendor decks I see, reply rates rarely appear on the slides where pharma customer logos do, and the reason is structural.
A send count only goes up. A logo wall only gets longer. A reply rate can fall, and it has to be counted from the HCP’s side of the conversation, which means a program has to be able to see that side at all.
That is where the commercial model decides what can be counted. A model built on rented reach, a list and a channel someone else controls, can report what it sent, because sending is the part it owns. It cannot report what came back, because the conversation, when there is one, happens somewhere it doesn’t own. A model that owns the relationship can see the answer, so it can count it.
This is the July assumption, one level up. The list takes the phone number for the relationship. The logo wall takes the contract for the engagement. Both count what sits on our side of the table and report it as the HCP’s.
A logo wall is what fills the slide when there is no reply rate to put there.
Why P360 replaced its logo slide with a reply rate
We had a logo slide too, and we took it out of the deck.
In its place is one number: a 60% average reply rate.
It is a harder slide to stand behind. A logo invites a nod. A reply rate invites the question of how it was counted, and that question deserves an answer. What makes it worth the slide is what it counts: the HCP’s side of the conversation.
The question to ask any vendor: what is your HCP reply rate?
The one question our industry should put to every vendor in the room, P360 included, is short: what is your HCP reply rate, and how did you count it?
If the answer comes back as a logo, that is an answer too. Asking the question of others is the easy half. The harder half is being ready to answer it ourselves, every time a brand team asks.
Pharma commercial exists so that treatments reach the patients who need them, and that work depends on HCPs who are willing to answer. The companies that can show that willingness, counted and on the record, are the ones our industry will still trust in ten years. A logo is won once. A reply is something every program has to earn.
About the author
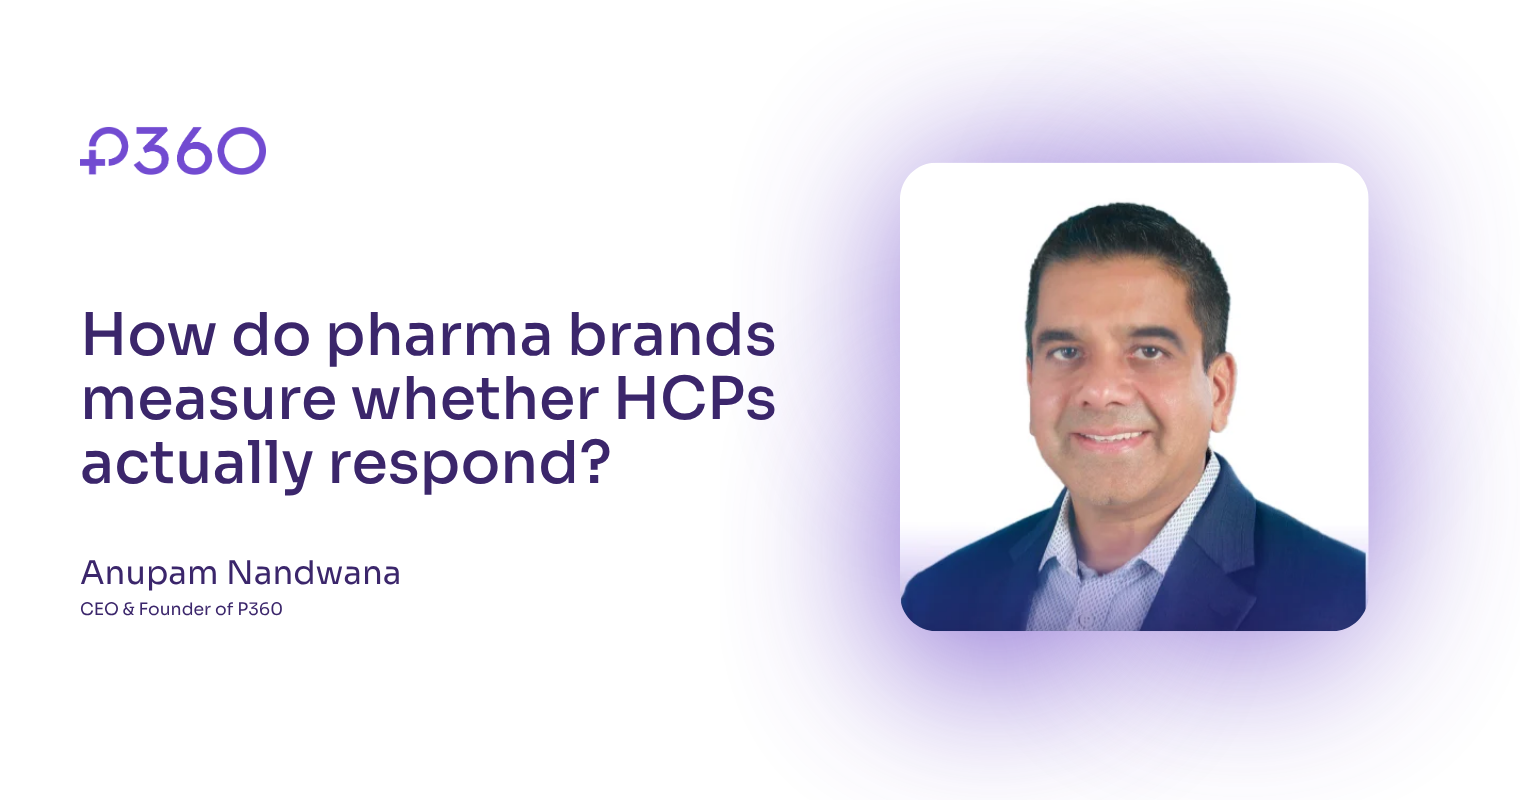
Anupam Nandwana is the CEO of P360. He writes about how pharma commercial actually runs: the operating assumptions underneath the commercial model, how the industry measures whether HCPs respond, and why trust and compliance are the ground the work stands on.
About CEO Corner
CEO Corner is P360’s leadership series on the commercial reality of pharma. P360 is the conversational engagement system.